Operational Efficiency Consulting: Real-time tracking for smarter factories

Operational Efficiency Consulting with IoT: Boost U.S. Manufacturing Productivity
Operational efficiency in IoT means using interconnected devices to gather real-time data, automate processes, and gain insights for faster, cheaper, and higher-quality delivery of goods/services by optimizing resource use, reducing waste, predicting issues (like maintenance), and enabling better decision-making, ultimately boosting productivity and cutting costs across industries.
Key Ways IoT Drives Operational Efficiency:
- Real-Time Monitoring & Control: Sensors track equipment, inventory, and conditions instantly, allowing quick responses to changes, minimizing downtime, and improving control.
- Predictive Maintenance: By analyzing sensor data, IoT predicts equipment failure before it happens, shifting from reactive to proactive maintenance, which cuts repair costs and prevents unexpected shutdowns.
- Automation: Smart systems automatically adjust settings (like HVAC in buildings) or trigger actions based on data, reducing manual intervention and operational expenses.
- Resource Optimization: IoT optimizes energy use (smart grids, buildings), inventory (tracking assets), and logistics (route planning).
- Data-Driven Decisions: Real-time data provides actionable insights for strategic decisions on pricing, production, and service delivery.
- Enhanced Safety & Quality: Monitoring environments for hazards and detecting errors early improves worker safety and product quality.
Examples Across Industries:
- Manufacturing (Smart Factories): Optimizing production lines, predictive maintenance for machinery, improving quality control.
- Logistics: Real-time shipment tracking, efficient route planning, better inventory management.
- Smart Buildings/Hospitality: Automated HVAC, lighting, and security systems for comfort, energy savings, and faster service.
In essence, IoT turns raw data into intelligent action, creating leaner, more agile, and profitable operations.
⚙️ Looking to streamline operations with tech?
Download our free guide: “The Ops Leader’s Guide to Improving Efficiency with IoT in 2025”
Learn how leading U.S. manufacturers and warehouses are using IoT to reduce downtime and boost productivity by up to 30%.
👉[Download the Guide]
Steps to Launch Your IoT Operator Efficiency Program
Implementing IoT for operator efficiency in your U.S. manufacturing facility does not require a complete overhaul or massive upfront investment. You can start small, demonstrate value, and scale up.
This practical roadmap helps operations managers and plant supervisors get started.
Step 1: Define Your Pilot Project and Metrics (Weeks 1-2)
Don't try to connect every machine at once.
- Identify a Bottleneck Machine: Choose a critical machine or production line where operator efficiency visibly impacts overall output or quality. Perhaps it's a legacy machine that frequently slows down or a new machine where operators are still learning.
- Select 1-2 Key Metrics: Focus on a simple MOE calculation. For example, start with Availability and Part Count (Performance). Adding quality sensors can come later.
- Set Clear Goals: Quantify your expected improvement. Aim for a 5-10% increase in availability or production rate on your pilot machine within 3-6 months. For example, "Increase Machine 4's average availability from 70% to 77% within 90 days."
Step 2: Choose Your IoT Hardware and Software (Weeks 3-6)
- Sensors & Gateways: For basic machine run time and part counting, simple current sensors (e.g., a Veris Industries H806 Current Switch for ~$50) and optical/inductive sensors (e.g., a Sick W27-3 Series Photoelectric Sensor for ~$150) are cost-effective. Pair these with an industrial IoT gateway (e.g., an HMS Anybus Communicator or a low-cost, rugged Raspberry Pi with industrial HATs for about $200-$500 total, depending on ruggedization).
- Operator Interface: A basic, rugged tablet (e.g., a used Samsung Galaxy Tab Active2 for $300-$500, or a new Getac T800 for $1,500+) with a simple web interface or a dedicated application will suffice for operator input.
- IIoT Platform: Start with a platform that offers a free trial or a flexible pricing model for small deployments. Options like ThingSpeak (for basic data visualization) or entry-level plans from MachineMetrics or Tulip can get you started. An average IIoT platform subscription can range from $50-$500 per machine per month, depending on features and data volume.
Step 3: Install and Connect Your System (Weeks 7-10)
- Sensor Installation: Mount current sensors to motor control panels. Position part-counting sensors securely. This often requires minimal electrical work and can be done by your in-house maintenance team or a local systems integrator.
- Gateway Setup: Connect the sensors to your chosen IoT gateway. Configure the gateway to send data to your IIoT platform. Most modern gateways offer intuitive web interfaces for setup.
- Operator Interface Deployment: Install tablets at operator stations. Ensure they have reliable Wi-Fi or cellular connectivity. Train operators on how to use the simple interface for logging downtime.
- Network Security: This is critical. Work with your IT department to ensure secure network segmentation for your IIoT devices. Use encrypted communication protocols (like TLS/SSL for MQTT) to protect your operational data. Companies like Palo Alto Networks offer industrial cybersecurity solutions to protect your OT network.
Step 4: Validate Data and Build Initial Dashboards (Weeks 11-14)
- Data Validation: For the first few weeks, manually verify data against the IoT system. Do sensor counts match physical counts? Are downtime reasons being logged correctly? Address any discrepancies immediately. This builds trust in the system.
- Dashboard Creation: Create clear, concise dashboards on your IIoT platform showing real-time machine status, part counts, OEE, and MOE. Display these on large screens where operators can see them.
- Start Simple, Scale Smart: Don't overload dashboards with too much information initially. Focus on the core metrics defined in Step 1.
Step 5: Train Operators and Cultivate a Data-Driven Culture (Ongoing)
- Operator Buy-in is Key: Explain why you are implementing this. Emphasize that it's about helping them work smarter, not about "Big Brother" monitoring. Highlight how real-time feedback helps them meet targets and identify issues faster.
- Interactive Training: Conduct hands-on training sessions for all shifts on how to use the operator interface and interpret the dashboards. Solicit their feedback on what works and what doesn't.
- Celebrate Successes: When you see a positive impact (e.g., a 7% reduction in unscheduled downtime on Machine 2), share it widely. Recognize operators who embrace the new tools. This reinforces the positive impact and encourages broader adoption.
Step 6: Analyze, Iterate, and Scale (Ongoing)
- Regular Review Meetings: Hold weekly meetings with supervisors and operators to review performance data. Discuss trends, identify root causes for inefficiencies, and brainstorm solutions.
- A/B Testing: Test different operational approaches. For example, if you suspect material staging is a bottleneck, try a new staging method for one operator group and use IoT data to compare their MOE to a control group.
- Expand Gradually: Once your pilot project demonstrates clear ROI (e.g., a 10% increase in productivity on a $500,000/year machine can yield $50,000 in annual savings), expand to other machines or lines. Prioritize areas with the greatest potential impact.
By following this practical, step-by-step approach, U.S. manufacturers can implement IoT solutions effectively, gain measurable improvements in machine operator efficiency, and build a more competitive, data-driven factory floor. This isn't just theory; it's a proven path to tangible results.
✅ Want to identify hidden inefficiencies in your process?
Use our Operational Efficiency Checklist, built for U.S. operations teams looking to reduce costs, improve uptime, and eliminate waste through automation.
👉[Get the Checklist]
Case Study: Automotive Component Manufacturer in Michigan
A Tier 1 automotive component supplier in Michigan struggled with inconsistent output and high scrap rates on their assembly lines. Operators were manually logging production data, leading to delays in identifying issues.
IoT Solution: We implemented an IoT solution that connected to their existing PLCs on 50+ assembly machines and added proximity sensors for accurate part counting. Each operator workstation was equipped with a tablet allowing for digital downtime reason entry and real-time performance feedback. The data was streamed to a cloud-based IIoT platform.
Impact:
- Reduced Unplanned Downtime by 20%: By precisely categorizing downtime, they discovered that "waiting for materials" and "minor adjustments" were significant contributors. This led to optimizing material flow and providing operators with basic troubleshooting training.
- Improved Operator Performance by 15%: Real-time dashboards showing individual operator output against targets created a sense of ownership and healthy competition. Operators could immediately see if they were falling behind and adjust, often before a supervisor intervened.
- Decreased Scrap Rate by 10%: By correlating specific operator actions and machine parameters with quality rejects, they identified critical training gaps and adjusted machine settings, leading to a noticeable reduction in defective parts. This also reduced costs associated with rework and material waste, a crucial factor for profitability in the highly competitive automotive sector.
The MOE Formula: A Practical Breakdown
Machine Operator Efficiency (MOE), also known as Overall Labor Effectiveness (OLE), focuses specifically on the human element at the machine. It complements Overall Equipment Effectiveness (OEE), which measures machine performance.
MOE combines three critical factors.
Availability
How much of the scheduled time an operator is actively engaged with the machine and contributing to production.
Calculation: (Actual Operator Run Time ÷ Scheduled Work Time) × 100%
Example: An operator is scheduled for an 8-hour shift (480 minutes) and spends 400 minutes actively running the machine.
Availability = (400 ÷ 480) × 100% = 83.3%
Performance
How fast the operator works compared to the ideal cycle time for producing a quality part. This measures speed and consistency.
Calculation: (Actual Parts Produced ÷ Expected Parts Produced based on Ideal Cycle Time) × 100%
Example: If the ideal cycle time is 1 minute per part, the expected output is 60 parts per hour. If the operator produces 55 parts:
Performance = (55 ÷ 60) × 100% = 91.7%
Quality
The percentage of good, sellable parts produced without defects or rework.
Calculation: (Good Parts Produced ÷ Total Parts Produced) × 100%
Example: Out of 55 parts produced, 52 meet quality standards:
Quality = (52 ÷ 55) × 100% = 94.5%
Your overall MOE is a multiplication of these three percentages:
MOE = Availability x Performance x QualityIf we use our examples: 83.3 MOE. Tracking these components individually tells you precisely where the inefficiencies lie.
This practical formula becomes powerful with real-time IoT data.
Connecting Operator Performance to Your Bottom Line
Measuring machine operator efficiency (MOE) isn't just an academic exercise. The true power emerges when you connect these granular insights to your broader manufacturing KPIs: machine uptime, quality control, and overall throughput. This integrated view allows plant supervisors and manufacturing engineers to make decisions that directly impact the factory's financial performance.
I've worked with numerous U.S. companies where linking these metrics has driven significant cost savings and revenue growth.
Improving Machine Uptime and Reducing Costly Downtime
Unplanned downtime costs U.S. manufacturers an estimated $50 billion annually, according to industry reports.
IoT helps pinpoint the human contribution to this.
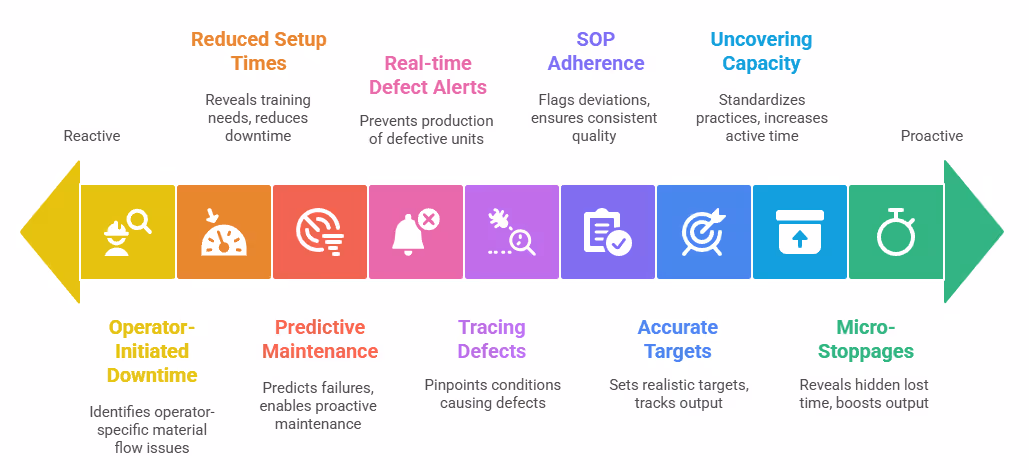
- Operator-Initiated Downtime Analysis: With IoT, you know exactly when a machine stops and why the operator logged it. If Machine 3 in your Minnesota plant is frequently showing "waiting for material" logged by Operator A, while Operator B on the same machine has no such log, it indicates a potential material flow issue specific to Operator A's setup routine or an external bottleneck they're experiencing. This insight allows you to investigate the process impacting the operator, rather than just blaming the operator.
- Reduced Setup & Changeover Times: For example, at a custom fabrication shop in Oregon, we tracked changeover steps using IoT-enabled tablets. Operators logged each task (e.g., "tool change," "fixture adjustment"). The data showed that a specific machine's changeover time averaged 45 minutes, but for Operator C, it was consistently 60 minutes. This wasn't a performance issue for Operator C, but rather revealed they lacked specific training on the complex fixture setup, leading to 15 minutes of extra downtime per changeover, costing the plant roughly $50 per hour in lost production time. Targeted training on that one step reduced Operator C's changeover time by 20%.
- Predictive Maintenance through Operator Feedback: When operators log a "minor fault" or "unusual noise" via an IoT HMI, this qualitative data can be combined with sensor data (like vibration analysis from a Monnit wireless accelerometer sensor). This correlation can help predict larger machine failures, shifting from reactive to proactive maintenance.
Enhancing Quality and Minimizing Scrap Costs
Poor quality parts can cost manufacturers up to 15-20% of revenue in rework, scrap, and warranty claims.
IoT helps link quality issues directly to operator actions or process deviations.
- Real-time Defect Alerts: Deploying inline quality sensors or vision systems (e.g., a Keyence IV3 Series vision sensor) allows the system to detect defects instantly. If a part from Operator D's station on your assembly line in Pennsylvania shows a recurring cosmetic flaw, the system immediately alerts the operator and supervisor. This prevents the production of hundreds more defective units.
- Tracing Defects to Root Cause: By correlating quality data with operator login times, machine parameters (speed, temperature, pressure), and logged process changes, you can pinpoint the exact conditions that led to defects. For instance, a pharmaceutical packaging plant in New Jersey used IoT to discover that a 3% increase in packaging defects occurred only when Operator E ran a specific machine at 105% of the recommended speed, demonstrating a clear link between operator-driven speed and quality degradation. Slowing that specific operator's setting to 100% reduced defects by 2.8 percentage points, saving thousands in packaging material.
- Ensuring SOP Adherence: IoT can monitor if operators are following standard operating procedures (SOPs) by tracking process parameters. If an operator adjusts a machine setting outside the prescribed range, the system can flag it, helping maintain consistent quality.
Maximizing Throughput and Production Output
Ultimately, improved operator efficiency directly boosts your factory's ability to produce more quality goods.
- Accurate Production Targets: With automated part counting, your hourly and daily production numbers are precise. You can set realistic targets and track actual output against them for every operator and shift.
- Uncovering Hidden Capacity: A U.S. auto parts supplier in South Carolina believed their lines were running at maximum capacity. After implementing IoT for operator efficiency, they found that operators on different shifts had varying "active time" percentages. By standardizing best practices for material staging and break management, they increased active operator time by an average of 7%, leading to an equivalent boost in daily output without new equipment.
- Identifying Micro-Stoppages: Many small, unlogged stops accumulate to significant lost time. An operator might pause for 30 seconds to adjust a fixture or clear a small jam. Individually, these are minor. Collectively, over an 8-hour shift, they can account for 30-60 minutes of lost productivity. IoT's continuous data capture reveals these patterns. A metal stamping facility in Illinois found that these "micro-stoppages" accounted for 1 hour and 10 minutes of lost operator time per shift on average, equivalent to 14.5% of their total potential output, simply by observing when current consumption briefly dropped below operating thresholds.
By integrating these data points, U.S. manufacturing engineers gain a comprehensive "digital twin" of their production environment. This allows for sophisticated analysis and a deeper understanding of the interplay between machine performance, process variables, and human efficiency, leading to higher revenue and a stronger competitive edge.
Comparing Machine Operator Efficiency Metrics:
What's Next
Ready to move your U.S. manufacturing operations from guesswork to data-driven precision? Let's connect and discuss how a tailored IoT solution can put real-time insights into your hands, enabling your team to boost productivity and secure a stronger competitive edge.